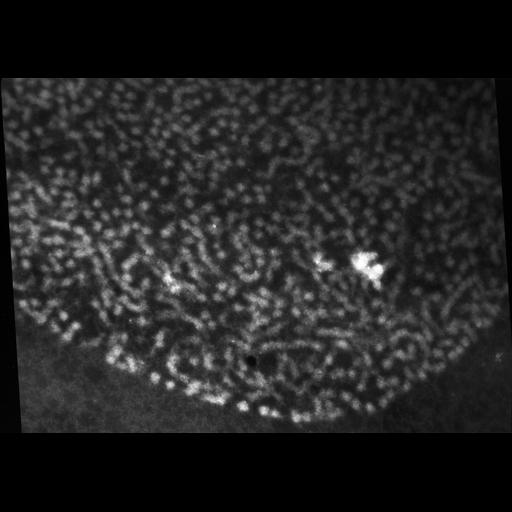
Upon electron bombardment, some elements, such as P, show an electron energy loss profile with a peak at a specific energy loss value. By collecting a series of images of a field at different energy losses, it is possible to compute the relative amount of the element at each pixel and map the element's distribution, a technique known as electron spectroscopic imaging (ESI) or electron filtered transmission EM (EFTEM). The 4 images in this group were recorded from unstained <30 nm section with 5 eV energy windows centered on 120, 104, 160 and 170 eV respectively using a Zeiss 902 energy filtered EM, making it possible to map the distribution of phosphorus (energy loss edge 160 eV) within the chromatin fibers. This image was recorded at 120 eV.
| Spatial Axis | Image Size | Pixel Size |
|---|---|---|
| X | 4011px | 0.4µm |
| Y | 2804px | 0.4µm |